I had a lot of trouble getting the income calculator java code to work in the previous post then i discovered a poorly written post that clued me in. If you copy paste java script code into the edit html portion of the blogger editor it wont work. Thats because when the post is published blogger converts carriage returns into <br > messing up the java script.
If you want javascript to work you have to put the entire javascript code block on one line. Thats an impossible task to do manually for complex code blocks. So write and test them elsewhere and then once your satisfied it works use this tool. It will strip the new lines placing the entire block of text on one line. Copy and Paste the single line version of your code into the blog editing pane in the blogger editor and you are good to go.
Thursday, April 21, 2011
Where Do I Stand? Income disparity and me.
I was looking for a calculator that would visualize income disparity for me as an individual but I couldn't find one. The closest I came was a javascript tool created as part of the great article series: The Great Divergence by Tim Noah at Slate. He also did the excellent healthcare plan comparative series during the 08 Democratic primaries. The visual essay compiled for the series is available here . I also suggest you read the articles here.
As for that comparative income calculator:
How you compare:
$52,059
Anyway this was compiled by the folks at Slate using publicly available data This is based on a normal distribution. The actual distribution of incomes has a key outlier though, the people at the very top make a lot more than the mean. There is a football field metaphor description of this at the L-Curve. Here is a video explanation, I warn you though the voice over sounds like Ben Stein on Ambien.
So grab your tax statement, find your income percentage with the tool, and take a look at what yard line your on.
As for that comparative income calculator:
Where do I stand?
Enter your zip code and income to find out where you fall on the curve.
How you compare:
$52,059
Sources: American Community Survey (State and National Data), IncomeTaxList (Zip code data).
NOTE: All information you enter is private and will not be recorded or stored in any way.
Anyway this was compiled by the folks at Slate using publicly available data This is based on a normal distribution. The actual distribution of incomes has a key outlier though, the people at the very top make a lot more than the mean. There is a football field metaphor description of this at the L-Curve. Here is a video explanation, I warn you though the voice over sounds like Ben Stein on Ambien.
So grab your tax statement, find your income percentage with the tool, and take a look at what yard line your on.
Wednesday, April 13, 2011
Fun with Graphs: Deficit Edition
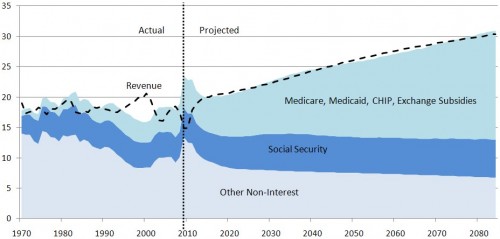
I have seen two articles that point out that if we locked the doors of the Congress and prevented anything from happening the budget would come under control in a few years. The first was at Slate by Annie Lowrey and the second was at Daily Kos had a graphic created by the Incidental economist Blog using CBO data.

Note how revenue suddenly jumps to catch up with all those piles of liabilities we have. As the articles explain there are three actions that Congress must takesto keep us in debt. The first was extending the Bush Tax Cuts which were set to expire this year and will now expire next year. The other two they do every year because if they didn't a lot of people would be mad. One annual event is renewing the Alternative Minimum Tax dodge for middle income families. The second is circumventing the codified funding of Medicare to pay doctors rates higher than they would be under the original law.
Rather than do any of those unpopular things the Republican budget choose to do other unpopular things: cut a bunch of programs and privatize medicare. Paul Ryan shows how this will save us all a bunch of money in this video as shown on the daily show last night (I couldn't find the original video.) Check out those slick graphs.
As Stewart points out with his own graphs the elimination of the Bush Tax Cuts does essentially the same thing without destroying medicare and medicaid. Thats the rub for the Republican Party, as Scott Walker and other Governors have shown. There is always room in a budget to give rich people more money. Even when confronted by serious problems the Republican solution is give rich people more money. That was the agenda of the Federal Reserve during the Banking Panic and thats the plan now that the Bush fiscal Chickens have come home to roost.
Thursday, February 24, 2011
AAAAAHHHHHH Class
http://motherjones.com/politics/2011/02/income-inequality-in-america-chart-graph
A few Choice examples ( Click to get a clearer image )
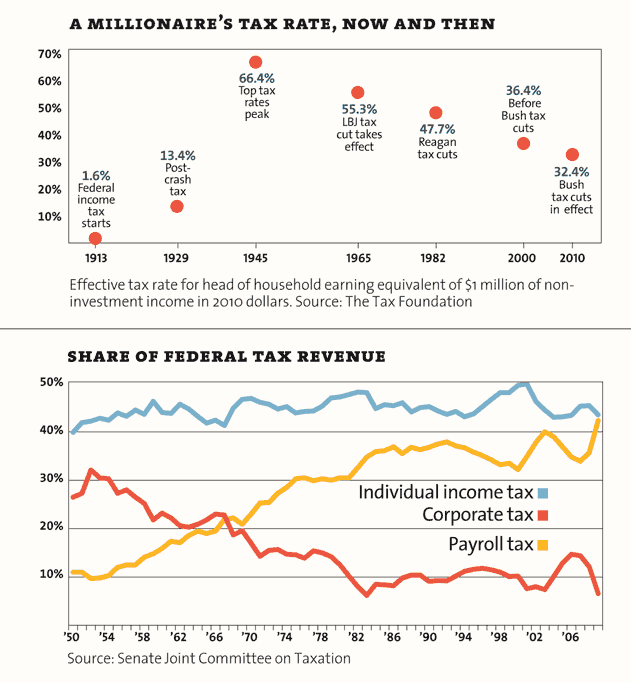
Payroll tax is only paid on the first $100,000 or so of payroll income. It is paid by the middle class and the poor.

People think they are better off than they are.
 And income disparity has gone up and up and up.
Monday, September 27, 2010
You're not rich!!!!
Unless you are, then you really really are. Im sorry but if you make more than 250K a year you are part of the upper echelon. Tim Noah at Slate wrote a 10 part series and this follow up on the subject of income and wealth disparity in the US. (http://www.slate.com/id/2268872/ )
In particular his latest article confirmed what I suspected: no one knows just how rich the rich and by extension poor they are.

So if you are getting fed up with it I have a poorly xeroxed socialist newsletter for you.

So if you are getting fed up with it I have a poorly xeroxed socialist newsletter for you.
Monday, July 26, 2010
Clone Amarok (1.2 of course) on OSX

Above is a screen shot of thje windows I have cobbled together to simulate the music listening experience of Amarok 1.2. Upper Left is of course the iTunes Window. It is on top of the album art viewer window also a part of itunes. That covers the boring bit of the Last.Fm application which loads artist info. Finally i have the tunesTEXT widget to retrieve and display lyrics.
To get the widget to stay on your desktop you have to put the Dashboard in developer mode. Which is done with the terminal.
defaults write com.apple.dashboard devmode YES
type that in terminal and you can drag widgets out from your dashboard to your desktop. just click and holding the widget while you press f12.
You can customize how itunes displays your track listing of course or ditch it altogether and use the visualizer instead of the Album art window. Here is an example using the iVisulize plugin.

PS. By the way if you use two monitors you may not be able to get visualizations to start on the secondary display. This happens to me when their default setting is full screen. I have to start the visualizer with the iTunes window on the primary display (it has the Apple Menu Bar) and then escaping from full screen. Once the visualizer is windowed you can move itunes back to the secondary display.
Friday, May 7, 2010
Kentucky Go-Fast
I spent some money on my car this spring. I broke a bolt on my car taking the resonator off my intake, so I bought some flexible intake duct ($15) and created a cold air intake for my car. It already has a K&N filter in the stock airbox. Later I was on craigslist and some one was selling some wheels. They came off a 98 neon l that had been sitting in his garage since 2006 when he tore the transmission out of it. They fit both my hubs and the exisiting tires on the car so i bought them for $35 per wheel. They are 5 spoke borbet wheels that are 15x7, the exisitng tires are 205/60 Nokian i3. Another $100 in mounting balancing and lug nuts resulted in this:

The air intake sits behind that black inlet in the bumper. The wheels increased the track width such that the tires are flush with the fenders at the top of the arch where before there were flush with the fenders at the bottom of the arch.

The air intake made the car louder, and resulted in a increase in mileage 30 mpg over my previous 28 mpg.
Subscribe to:
Posts (Atom)

